This is the case study done by my regarding 306 patients who were suffered from breast cancer.
The dataset contains cases from a study that was conducted between 1958 and 1970 at the University of Chicago’s Billings Hospital on the survival of patients who had undergone surgery for breast cancer.
Number of Instances: 306
Number of Attributes: 4 (including the class attribute)
Attribute Information:
- Age of patient at time of operation (numerical)
- Patient’s year of operation (year - 1900, numerical)
- Number of positive axillary nodes detected (numerical)
- Survival status (class attribute) 1 => the patient survived 5 years or longer, 2 = the patient died within 5 year
Information from Kaggle -https://www.kaggle.com/gilsousa/habermans-survival-data-set/data
Domain Information-
- Axiliary nodes are those nodes which are present in underarm area and a normal body have about 20-40 axiliary nodes.The role they play is to drain the lymph (a clear or white fluid made up of white blood cells) produced from the breasts and surrounding areas, including the neck, the upper arms, and the underarm area.
- Positive axiliary nodes signifies the number of axiliary nodes which are damaged due to breast cancer and they have to removed by surgeon during surgery.
The connection-
-
The axillary lymph nodes are usually the first set of lymph nodes where breast cancer will spread.
-
And because the breast and armpit are close to each other, the lymph nodes are a common place where this type of cancer spreads.
-
As a general rule, the more a cancer has spread from its starting point, the worse the prognosis may be for a person.
-
Also, if the cancer has spread to the axillary lymph nodes, a doctor will usually recommend removing the lymph nodes during the surgery to remove the originating tumor.
-
Lymph nodes are responsible for draining lymph fluid, so their removal can cause some side effects after surgery
#importing required libraries for doing EDA
import numpy as np
import pandas as pd
import matplotlib.pyplot as plt
import seaborn as sns
from pprint import pprint
from pandas_profiling import ProfileReport
import warnings
warnings.filterwarnings("ignore")
#Let's load the dataset into Pandas Dataframe
data = pd.read_csv("haberman.csv",header=None,names=["Age","Year of operation","Number of positive axiliary nodes detected","Survival status"])
# Let's analyse the shape of the data and as well as first five rows of data to know about the structure of dataset
print(data.shape)
data.head()
(306, 4)
| Age | Year of operation | Number of positive axiliary nodes detected | Survival status | |
|---|---|---|---|---|
| 0 | 30 | 64 | 1 | 1 |
| 1 | 30 | 62 | 3 | 1 |
| 2 | 30 | 65 | 0 | 1 |
| 3 | 31 | 59 | 2 | 1 |
| 4 | 31 | 65 | 4 | 1 |
Questions that can be answered :-
Q1 - Does the success of surgery depends upon age of patient or not ?
Q2 - The number of positive axiliary nodes detected have anything related to the remaining life of patient ?
Q3 - Does number of positive axiliary nodes detected directly depend upon age ?
Q4 - Given this information can you classify whether the patient will more than 5 years or not ?
#As column "Year of operation" of our dataset has value equal to "year -1900"
data["Year of operation"] = data["Year of operation"] + 1900    #Adding 1900 to make it more understandable
#Let's have a look at descriptive statistics of the data
data.describe()
| Age | Year of operation | Number of positive axiliary nodes detected | Survival status | |
|---|---|---|---|---|
| count | 306.000000 | 306.000000 | 306.000000 | 306.000000 |
| mean | 52.457516 | 1962.852941 | 4.026144 | 1.264706 |
| std | 10.803452 | 3.249405 | 7.189654 | 0.441899 |
| min | 30.000000 | 1958.000000 | 0.000000 | 1.000000 |
| 25% | 44.000000 | 1960.000000 | 0.000000 | 1.000000 |
| 50% | 52.000000 | 1963.000000 | 1.000000 | 1.000000 |
| 75% | 60.750000 | 1965.750000 | 4.000000 | 2.000000 |
| max | 83.000000 | 1969.000000 | 52.000000 | 2.000000 |
Takeaways -
- Our data has not any missing value in any of the column. Cheers!
- The age of the patients is centred around 52 with standard deviation equals to 10.83.
- Our data is uniformly distributed with respect to “Year of operations” observation as we have almost same number of observations or rows for each year and which can be concluded by looking at Percentile values.
- The number of positive axiliary nodes detected are centred around 4 with standard deviation equals to 7 and with maximum value equal to 52.
- Survival staus has just 2 values 1 and 2
# Let's have a look at how many patients had survived more than 5 years out of 306 patients ?
data["Survival status"].value_counts()
1    225
2     81
Name: Survival status, dtype: int64
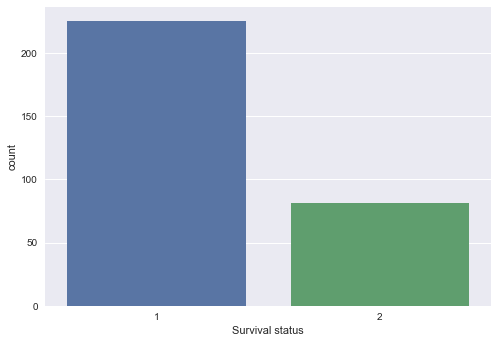
225 patients had survived more than 5 years out of 306 patients .
- It’s great to see the survival rate of living more than 5 years after surgery is 73.5% but there is a lot more to improve as it will be better if we can save more and more lives !
# Let's visualize the same by plotting count plot
sns.countplot(x="Survival status",data=data)
plt.show()
Distribution of Number of positive axiliary nodes detected - Histogram with KDE
fig = plt.figure(figsize=(12,12))
g = sns.FacetGrid(data,hue="Survival status",size=6)
g.map(sns.distplot,"Number of positive axiliary nodes detected",kde=True)
g.add_legend()
plt.show()
<matplotlib.figure.Figure at 0x44061bf4a8>
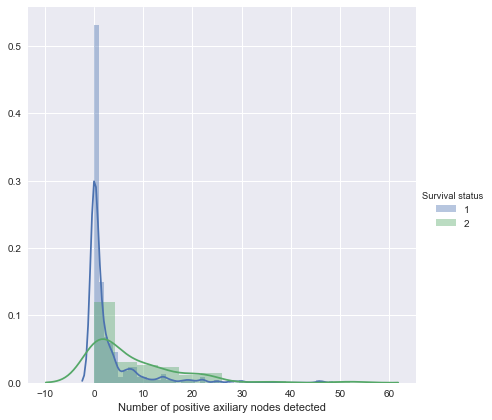
Takeaways-
- We can not conclude anything about survival status from the Number of positive axiliary nodes detected by observing this distribution.
Correlation matrix -
correlation = data.corr() #returns correlation between two columns for each set of two columns
sns.set()
sns.heatmap(correlation,annot=True,cmap="coolwarm") #visualizing it with the help of Heatmap
plt.show()
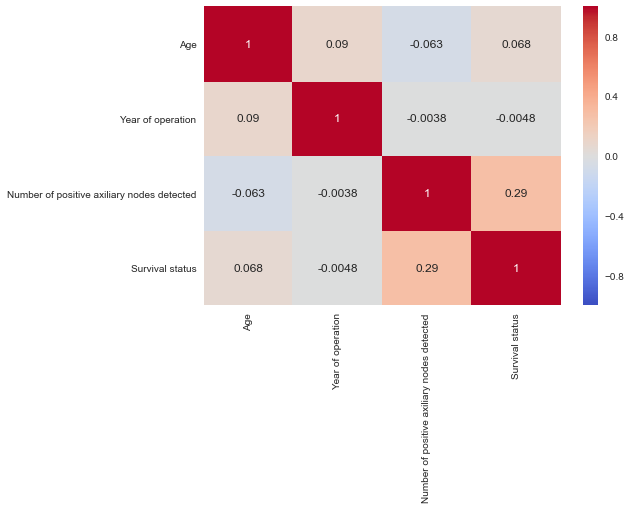
Takeaways-
- It is confirming our belief that there is no correlation between two columns of our data except between number of positive axiliary nodes detected and Survival status of 0.2
It is also answering our Q3 - Does number of positive axiliary nodes detected directly depend upon age ?
- As there is no correlation between the two hence, number of positive axiliary nodes detected does not depend upon age of patient
Exploring the data further -
Let’s look at the average values of Age and Number of positive axiliary nodes detected for different status of Survival after surgery to get our answer
# Using pivot table for this purpose
data.pivot_table(index="Survival status",values=["Number of positive axiliary nodes detected","Age"],aggfunc=np.mean)
| Age | Number of positive axiliary nodes detected | |
|---|---|---|
| Survival status | ||
| 1 | 52.017778 | 2.791111 |
| 2 | 53.679012 | 7.456790 |
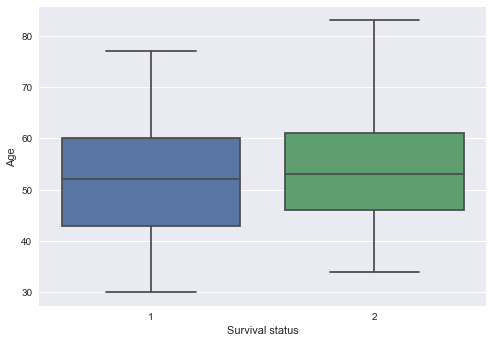
# Visualizing the answer given by pivot table using Boxplot
sns.boxplot(x="Survival status",y="Age",data = data)
plt.show()
sns.boxplot(x="Survival status",y="Number of positive axiliary nodes detected",data = data)
plt.show()
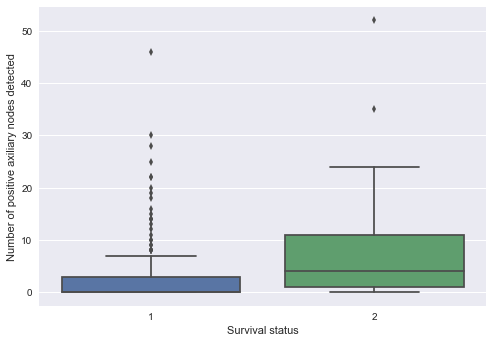
Conclusions :
- It is clearly showing us that Number of positive axiliary nodes detected is the most important feature for classification as there is a very large difference between the central value of Number of positive axiliary nodes detected for those survived more than 5 years and those who had not which is signifying that more number of positive axiliary nodes means that the cancer has extended to large level and thus there is very maximum probability that it will not let live the patient more than 5 years and thus answering our Q2 - The number of positive axiliary nodes detected have anything related to the remaining life of patient ?
- It is also confirming our initial belief of Q1 - Does the success of surgery depends upon age of patient or not ?
No,the success of surgery does not depends upon the age of patient as there is very less difference between the central value of age for those who had survived for more than 5 years and those who hadn’t. - A number of positive axiliary nodes detected does not depend upon age